When you hear the news that prescription drug costs are climbing, it’s easy to feel stuck. But there’s a hidden economic engine working quietly behind the scenes that keeps those bills lower than they could be. Every single year, the U.S. government approves new versions of medicines that have lost their patent protection. We call these FDA generic approvals, which are authorized under the Abbreviated New Drug Application pathway. These approvals trigger a massive shift in the marketplace, often slashing prices by 70 percent or more almost immediately. However, understanding exactly how much money is saved requires peeling back the layers of two different reporting systems, because the numbers you see depend entirely on who is doing the counting.
If you are trying to wrap your head around healthcare inflation, this breakdown is essential. It explains not just the headline figures, but where the money actually goes and why some years show a spike in savings while others dip. Let’s look at the hard numbers, the methods used to calculate them, and what this means for your wallet.
Quick Summary / Key Takeaways
How Savings Are Measured: Two Different Lenses
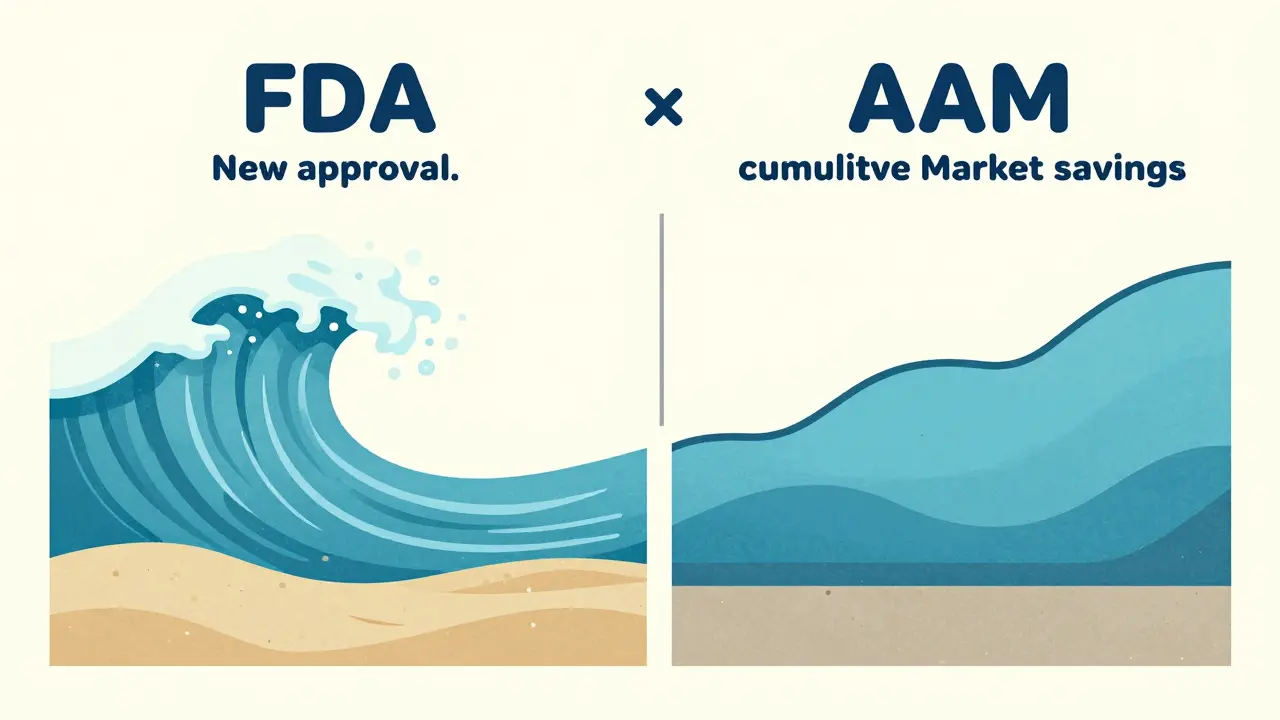
To make sense of the data, you first need to know that “savings” isn’t one single number. The FDA and the Association for Accessible Medicines use distinct methodologies to track the financial benefit of generic competition. Confusion arises when people compare apples to oranges, so let’s define what we are actually measuring. The Food and Drug Administration tracks the immediate impact of new entries. Specifically, they calculate savings generated during the first 12 months following a new approval. Their formula looks at the price difference between the brand-name version and the new generic version, multiplied by how many of the generic prescriptions were filled. If the brand name lowers its own price to compete, that’s counted too. This metric is great for seeing how effective a specific batch of approvals is right after they hit the market. On the other hand, the Association for Accessible Medicines (AAM) takes a wider view. They calculate the total annual savings across all generic drugs currently in use. This includes the cumulative effect of thousands of generics already sold alongside the newest arrivals. Think of the FDA method as measuring a wave hitting the shore, while the AAM measures the tide level. Both tell you something important about the ocean, but they aren't identical.
| Metric | Measurement Focus | Data Source | Typical Timeframe |
|---|---|---|---|
| FDA New Approval Savings | Savings from drugs approved in the calendar year during their first 12 months post-approval. | FDA Office of Generic Drugs | 12 Months post-ANDAs |
| AAM Total Market Savings | Cumulative savings from all generic drugs dispensed in a calendar year compared to brand-name prices. | Association for Accessible Medicines (AAM) | Calendar Year (All Generics) |
The Year-by-Year Breakdown (2018-2022)
Looking at historical data helps identify patterns. The savings generated from new generic approvals are surprisingly volatile. One year you might see billions saved, the next year much less. Why? It comes down to the "blockbuster effect." When a widely used, expensive brand-name drug loses its patent, the first generic to enter the market captures huge savings. If no major blockbusters come off-patent in a given year, savings numbers dip.
We can track this using FDA data regarding savings realized in the first 12 months of approval. Here is how the annual totals shifted over a critical five-year period:
- 2018: The baseline started at roughly $2.7 billion in savings from new approvals.
- 2019: A significant spike occurred, reaching $7.1 billion. This was the peak for that five-year stretch.
- 2020: The figure dropped sharply to $1.1 billion. This illustrates the volatility mentioned earlier; fewer major drugs entered the generic market in this cycle.
- 2021: Recovered slightly to $1.37 billion from first generics, but note that total savings including all generics reached $16.6 billion.
- 2022: Another surge happened, with savings jumping to $5.2 billion from first generics, and $18.9 billion in total savings from all applications fully approved that year.
Who Benefits Most From Generic Savings?
If billions are being saved, does that cash find its way to patients at the counter? Often, yes, but not always directly. The financial relief is distributed across three main groups: commercial insurance plans, government programs, and individual out-of-pocket spenders. Commercial insurers (private health coverage) capture a large chunk of the savings because they negotiate rebates. However, Medicare beneficiaries see substantial gains too. According to the Association for Accessible Medicines, Medicare accounted for roughly $137 billion in generic savings in 2023. On a per-person basis, that averages out to about $2,672 saved for every Medicare beneficiary annually. Medicaid follows closely, providing vital relief to state-funded healthcare programs. For the average patient filling a prescription, the benefit is simpler and more direct. Pharmacists report that 92 percent of generic prescriptions are filled at a cost of $20 or less. The average copay for a generic drug hovers around $7, compared to often exceeding $50 or $100 for the brand-name equivalent. While pharmacy benefit managers (PBMs) sometimes capture a portion of the rebate value, the sheer volume of lower-priced options forces list prices down across the board. Geographically, the savings scale with population. States with larger populations naturally record higher total dollar amounts, but the per-capita relief is consistent. California, for instance, recorded nearly $38 billion in savings in certain reporting periods due to its size, while smaller states still saw hundreds of millions in aggregate benefits.
Why Saving Money Fluctuates Annually
You might wonder why we don’t just see a steady upward line of savings year after year. The pharmaceutical market isn’t smooth; it’s lumpy. The primary driver is the patent cliff. When a company files for a patent, they get roughly 20 years of exclusivity. They plan their pipelines based on these windows. Sometimes, multiple blockbuster drugs expire in the same year. This causes a spike, like in 2019. Other times, there’s a quiet patch where only minor drugs come off-patent, resulting in lower savings figures like 2020. Additionally, regulatory hurdles can delay the inevitable. Sometimes brand companies file legal challenges that push the arrival of the first generic further down the road. The Hatch-Waxman Act established the framework for these challenges, balancing innovation incentives with competition needs.
Future Outlook: Biosimilars and Complexity
Looking ahead past today, March 2026, the landscape is shifting. Traditional small-molecule drugs (pills and tablets) continue to dominate the savings numbers. However, biologics are becoming more common. Biologics are complex medicine created from living cells, such as insulin or monoclonal antibodies. These are harder to copy than standard pills. The FDA calls their copies biosimilars. As of late 2024, there were 59 approved biosimilars in the market. They are expected to contribute increasingly to savings totals, though their impact has been slower to materialize compared to traditional generics. The FDA’s Generic Drug User Fee Amendments (GDUFA) have helped speed up reviews, with 95 percent of standard applications now reviewed within 10 months. Faster review means faster competition, meaning savings happen sooner for patients.
Despite potential obstacles like anticompetitive practices or complex risk evaluation strategies, the trajectory points toward sustained savings. Projections suggest the cumulative savings from 2014 through 2028 could reach nearly $3.9 trillion. By the late 2020s, we anticipate annual savings stabilizing around $450 to $500 billion, driven by an aging population needing more care and the continued loss of patents on older blockbuster drugs.
Conclusion
Generic drug approvals remain a cornerstone of healthcare affordability. While the headlines might focus on rising medical costs, the data clearly shows a powerful counter-force in action. The transition from brand-name to generic pricing is the single biggest factor keeping drug spending below projected levels. Understanding the nuances between FDA and AAM metrics allows us to appreciate the full scale of this economic benefit.
How much does a generic drug usually save compared to the brand name?
Prices typically fall by more than 70 percent once a generic version is approved. This immediate drop triggers the majority of annual savings calculations reported by the FDA.
What is the difference between FDA savings and AAM savings data?
The FDA calculates savings based on the first 12 months of new generic approvals. The AAM calculates total savings from all generic drugs used throughout the entire year, resulting in a much higher cumulative figure.
Do patients actually see lower copays?
Yes, although some savings stay within insurance plans via rebates. The average copay for a generic prescription is around $6.97, compared to significantly higher costs for brand-name equivalents.
Will savings grow in the coming years?
Projections indicate savings will continue to grow, potentially reaching $450-$500 billion annually by the late 2020s, driven by new patent expirations and increased biosimilar adoption.
Why did savings dip in 2020 compared to 2019?
Generic savings fluctuate based on patent cliffs. 2019 had several large-market drugs enter the generic space, while 2020 saw fewer blockbuster drugs lose patent protection, leading to a temporary dip in measured savings.
Shawn Sauve
I really appreciate this breakdown because it clarifies the confusing metrics we often see in the news cycles :) It helps to understand why my copays stay low even when headlines scream about inflation. The distinction between FDA new approval savings versus the broader AAM market effect makes so much sense now. Generics truly are the backbone of keeping healthcare accessible for regular folks like us. We should thank the regulatory bodies for speeding up those review processes whenever possible.
Poppy Jackson
quite simply the best explanation i have read on this complex topic
Jeannette Kwiatkowski Kwiatkowski
The nuance regarding patent cliffs is absolutely fascinating yet terrifyingly volatile for policy planning. One must consider how corporate litigation delays the inevitable erosion of exclusivity windows by years. It is interesting that the FDA measures the wave while the AAM measures the tide level of the entire economy. This discrepancy allows lobbyists to pick whichever number suits their narrative agenda perfectly. The data clearly shows that reliance on blockbuster expirations creates artificial boom bust cycles in revenue projections. We cannot ignore how rebate structures capture value before it ever reaches the patient pocketbook. The average consumer remains oblivious to the sophisticated financial engineering behind the pharmacy counter. Transparency here would fundamentally shift public perception of pharmaceutical profit margins significantly. Regulatory frameworks need to evolve faster than the current decade lag suggests otherwise. Economic modeling based solely on new approvals ignores the compounding benefits of established generic markets entirely. These shifts in valuation require constant monitoring by those of us who track industry trends closely.
Aaron Olney
i think ur missing the point tht big pharma just moves the goalposts anyway lol its obvious tbh the system is rigged against normal people trying to get meds without spending all thier money on insurance premiums. dont believe the hype about savings going to patients cos it doesnt happen half the time. companies file lawsuits just to delay generics forever and then charge more. we are stuck dealing with the mess. the gov does nothing about it.
Paul Vanderheiden
seeing these savings numbers makes me feel way better about the overall state of our health coverage systems
Jordan Marx
The economic implications of the Abbreviated New Drug Application pathway represent a critical infrastructure element in modern pharmacoeconomics. Understanding the variance between immediate first-year approvals and cumulative market saturation requires deep analysis of historical expenditure data. When patents expire the loss of monopoly power drives price elasticity significantly downward across multiple therapeutic classes. This dynamic interaction ensures that commercial payers maintain sustainable benefit structures despite medical complexity increasing elsewhere. Regulatory speed under GDUFA amendments accelerates competition entry which subsequently forces rebates higher throughout the supply chain. Patients ultimately benefit from the volume compression that occurs when multiple manufacturers compete for market share simultaneously. It is vital to recognize that biosimilars face different hurdles compared to traditional small molecule pill formulations today. Manufacturing complexity increases cost barriers preventing rapid generic substitution for biologics in the near term. Government programs like Medicare capture massive aggregate savings due to their sheer participant volume and negotiating leverage position. Medicaid populations rely heavily on these lower tier pricing mechanisms to maintain access during fiscal tightening periods. Pharmacy Benefit Managers play an intermediary role that complicates direct pass through savings to individual consumers occasionally. Rebate negotiations remain opaque and often obscure the true net cost basis utilized in annual reports released publicly. Policy stability depends on predictable patent expiration schedules rather than random spikes in blockbuster loss of protection events. Future projections indicate stabilization around four hundred billion annually assuming standard pipeline velocity continues unimpeded by external shocks. The collective impact on national debt reduction is substantial considering the aging demographic curve shifting dependency ratios upward.
kendra 0712
THIS IS SO IMPORTANT TO UNDERSTAND!!! I love how you explained the difference between the two metrics!!! It changes everything about how we view drug costs!!! We need more people talking about this!!! Thanks for sharing your knowledge!!!!
Sophie Hallam
It is good to see detailed information shared publicly instead of relying on vague media reports about drug prices. Everyone deserves clear understanding of where money goes in the healthcare system regardless of political affiliation. These insights help build trust between stakeholders and the communities affected by prescription costs daily.
Rohan Kumar
yeh sure right keep dreaming 🙄 the real reason prices drop is cause the quality gets worse 💊💸 corporations know exactly what they are doing 👁️ dont believe the stats bro 😂 it’s all a trick to make u buy less stuff later on 🤡📉